



How to Keep a Trading Journal: The Complete Guide (With Free Template)
· 11 min read · Lumivar Trading

Most traders know they should keep a trading journal. Very few keep one properly. They log a handful of trades, lose interest after a losing week, and go back to trading from memory, which is exactly where the same mistakes keep repeating.
A good trading journal does one job: it turns every trade you take into data you can learn from. Over a few months it shows you which setups actually make money, which hours you trade best, what your real win rate and risk/reward are, and how much breaking your own rules is costing you.
This guide covers how to keep a trading journal step by step: what to record for every trade, a free trading journal template, how to review your trades, and the metrics that matter. It works for forex, stocks, futures and crypto, whether you use a spreadsheet, a notebook or a dedicated trading journal app.
What is a trading journal?
A trading journal is a record of every trade you take, with the numbers (entry, exit, size, profit or loss) and the context (why you took it, how you felt, whether you followed your plan, what you'd do differently).
The numbers tell you what happened. The context tells you why. You need both: a list of P&L figures without context can show you're losing money, but not how to stop.
Why keeping a trading journal works
- It replaces memory with evidence. Traders remember their big wins and their most painful losses. A journal remembers everything, including the dozens of small, boring trades that decide whether you're profitable.
- It shows your real edge. You might feel like breakouts are your best setup. Your journal might show they're break-even and your pullback trades make all the money.
- It exposes behaviour. Revenge trades, moving stops, oversizing after a win: these patterns only become obvious when they're written down and counted.
- It makes improvement measurable. You can't improve win rate, average R or discipline if you don't measure them.
- It's how professionals work. Prop firms and trading desks review trades routinely. A journal gives you the same feedback loop.
What to record for every trade
The best trading journal is one you'll actually keep, so record what's useful and nothing more. These are the fields that matter, split into three groups.
1. The trade itself
- Date and time of entry (the session matters: London open trades behave differently from the New York afternoon).
- Symbol and market, such as EURUSD (forex), NQ (futures), TSLA (stocks) or BTCUSD (crypto).
- Direction: long or short.
- Entry and exit price.
- Position size: lots, contracts, shares or units.
- Fees and commissions. They add up, and leaving them out makes your results look better than they are.
- Net P&L, in money and as a percentage of your account.
2. Risk
- Stop loss where you placed it before entering.
- Amount risked, the money you'd lose if the stop was hit.
- R-multiple: the result divided by the amount risked. A trade that made twice what it risked is +2R; a full stop-out is −1R. R lets you compare trades of different sizes fairly, and it's the single most useful number in a trading journal.
If you're not sure what size to trade for a given stop, use a position size calculator before entering, then log the amount risked.
3. Context and psychology
- Setup or strategy: the name of the pattern you traded ("London breakout", "VWAP reclaim", "liquidity sweep"). Keep the names consistent so you can group trades later.
- Followed my plan? Yes or no, answered honestly. This one field is often the most revealing in the whole journal.
- Mindset going into the trade: calm, focused, anxious, tilted, FOMO.
- Grade: A to D for the quality of the execution, not the result. A well-executed trade can lose; a sloppy one can win.
- Notes and lessons: why you took it, what happened, what you'd do differently.
- Screenshots of the chart at entry and exit. A picture of the setup is worth more than a paragraph when you review it weeks later.
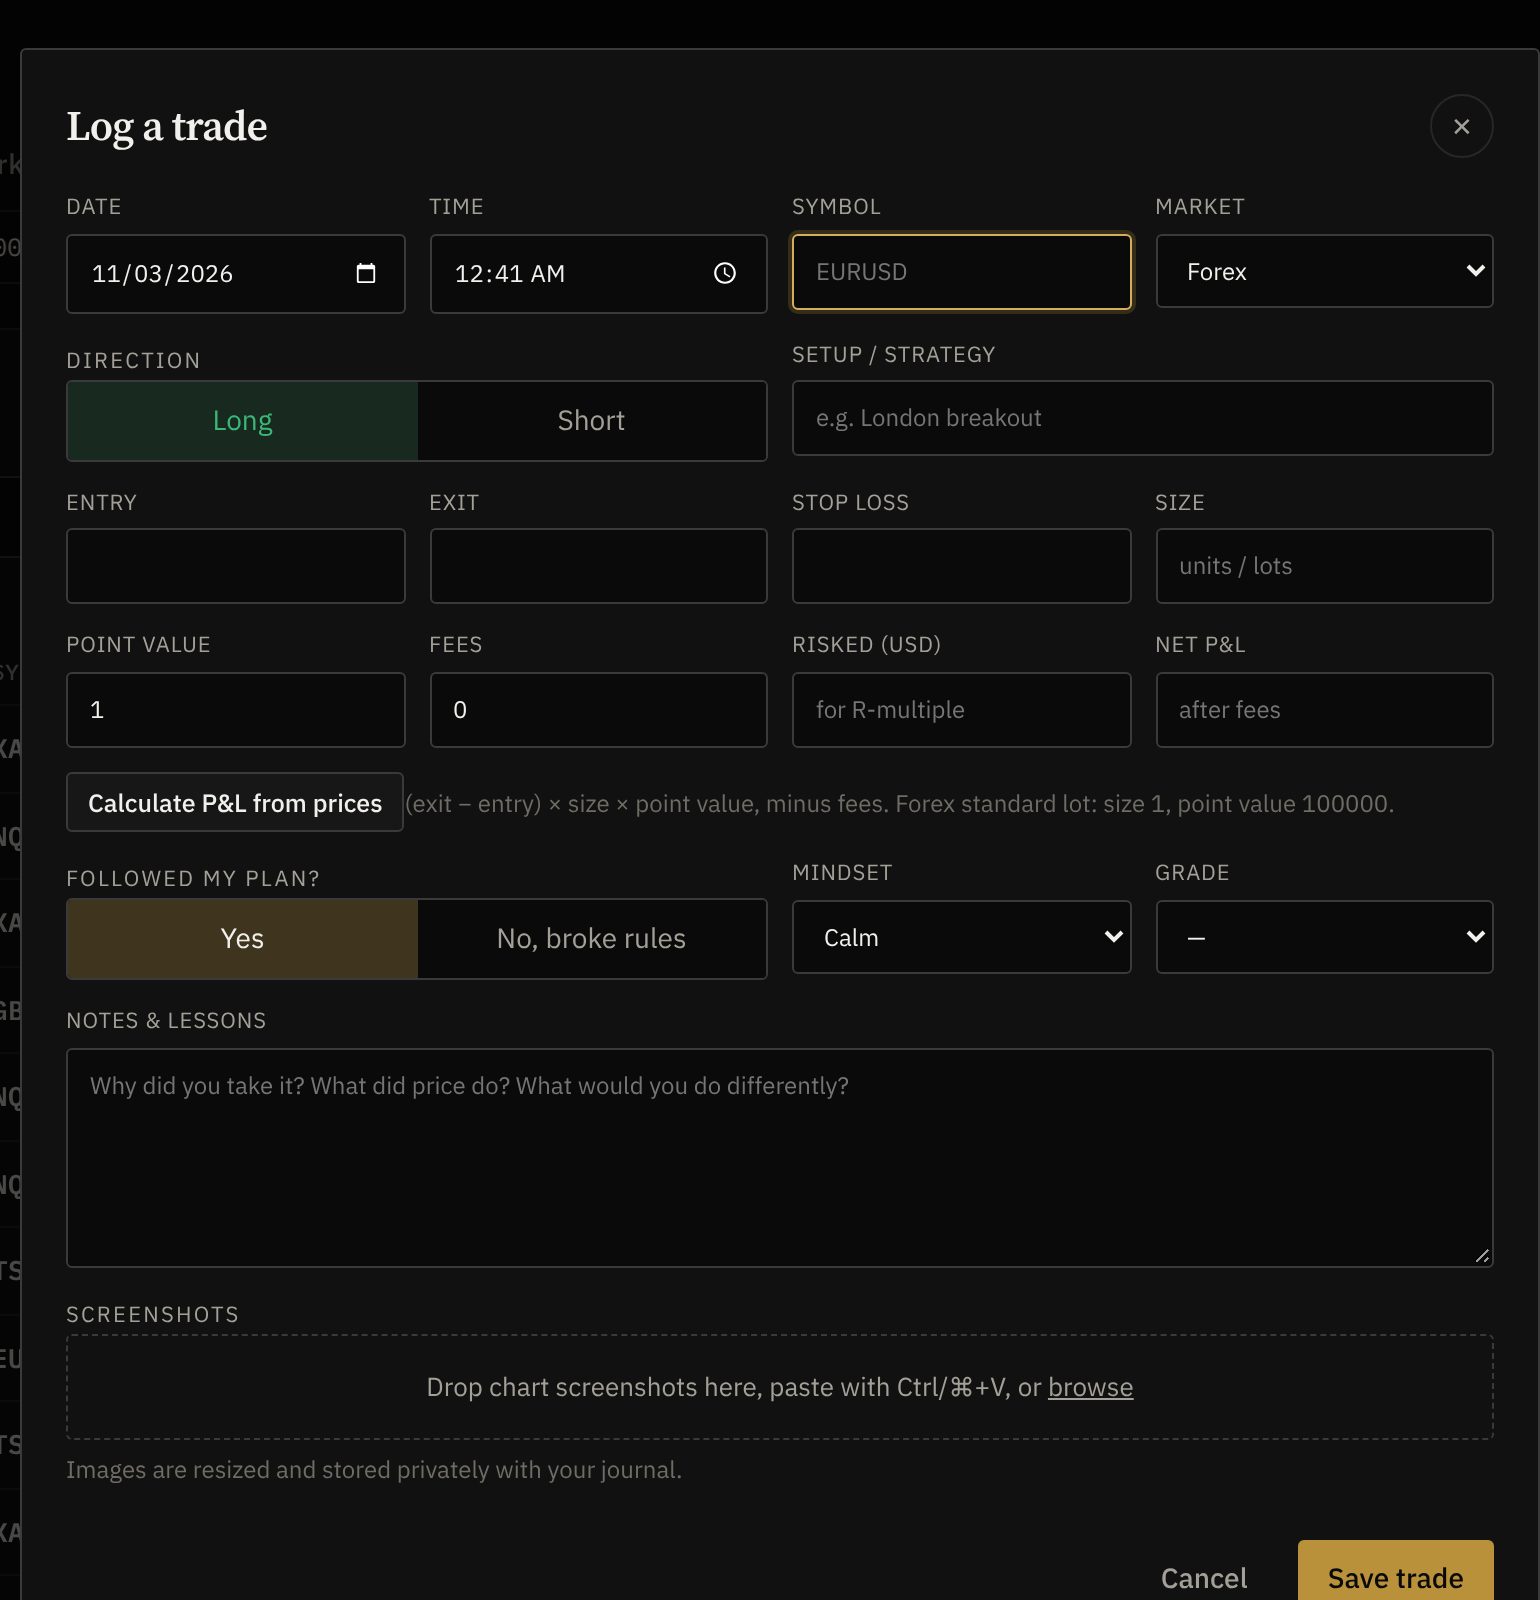 Logging a trade in Lumivar: the numbers, the risk and the context on one form. P&L and R are worked out for you.
Free trading journal template
Copy this into a spreadsheet or notebook as a starting point. One row per trade:
| Field | Example |
|---|---|
| Date / time | 28 Oct 2026, 14:30 |
| Symbol / market | NQ (futures) |
| Direction | Long |
| Setup | London breakout |
| Entry / exit | 20,410 / 20,452 |
| Stop loss | 20,380 |
| Size | 1 contract |
| Fees | $4.20 |
| Risked | $600 |
| Net P&L | +$835.80 |
| R-multiple | +1.39R |
| Followed plan? | Yes |
| Mindset | Calm |
| Grade | A |
| Notes | Waited for the retest instead of chasing. Took partials too early. |
| Screenshot | Link or file name |
A spreadsheet works, but it gets slow once you have hundreds of trades and want charts. A dedicated trading journal does the maths, keeps the screenshots with the trade and builds the reports for you.
How to keep a trading journal: step by step
Step 1: Log every trade, the same day
Consistency beats detail. Log every trade, winners and losers, ideally straight after you close it while it's fresh. If you only journal the trades you're proud of, your statistics will lie to you.
To save time, import trades from your broker or platform and add the context afterwards. Lumivar imports from MetaTrader, TradingView, Tradovate, NinjaTrader, Binance and more.
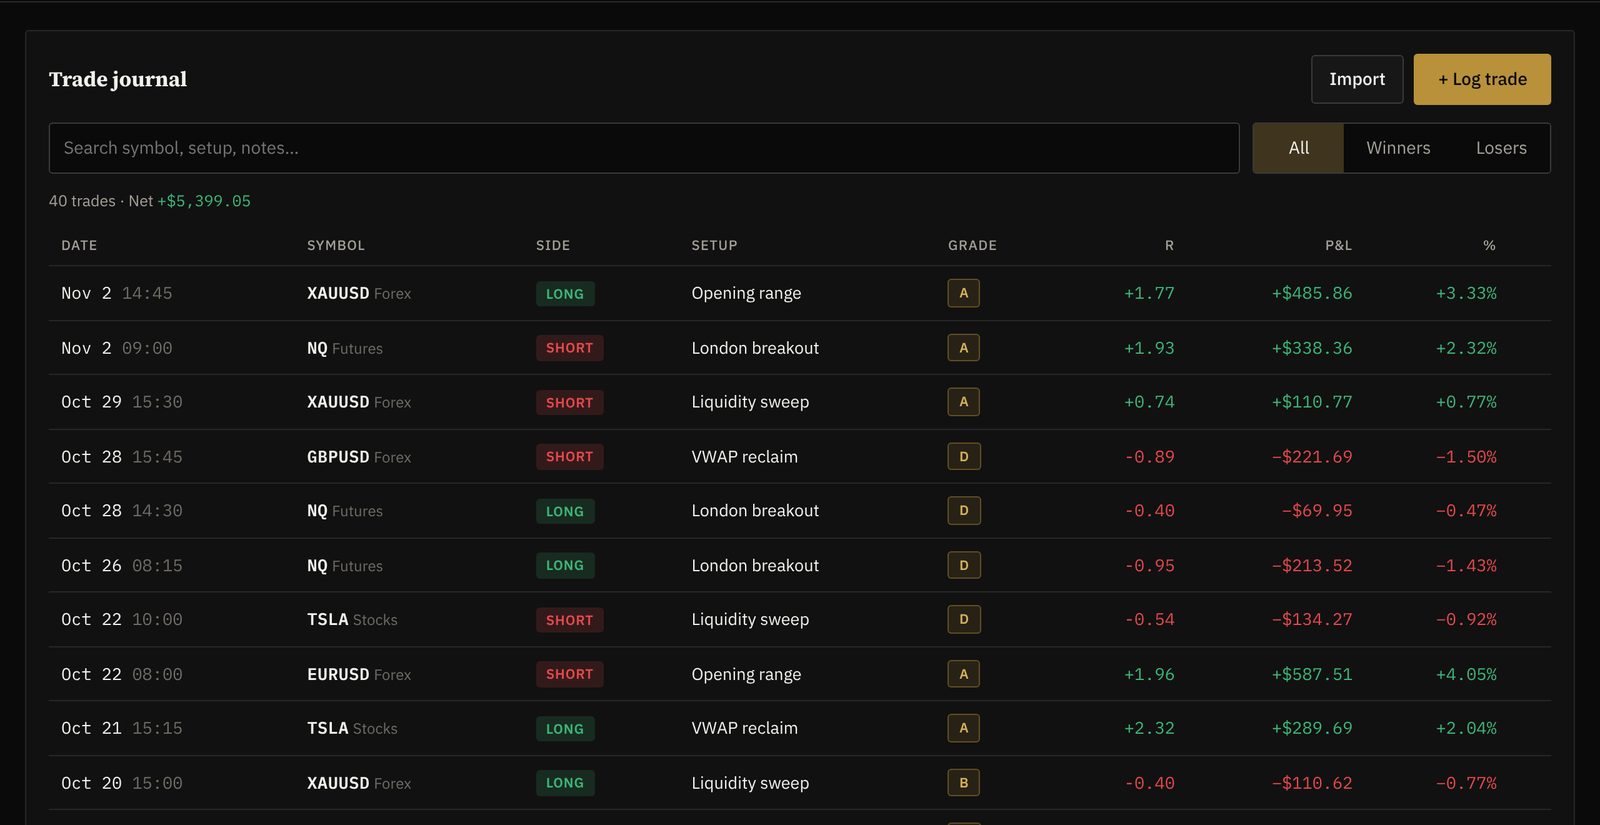 Every trade in one searchable list, with setup, grade, R and P&L. Filter to winners or losers in one click.
Step 2: Write the context while you remember it
The numbers can be imported; the context can't. Spend 30 seconds per trade on setup, plan, mindset, grade and one line of notes. Add a screenshot of the chart. That's the part that turns a trade log into a trading journal.
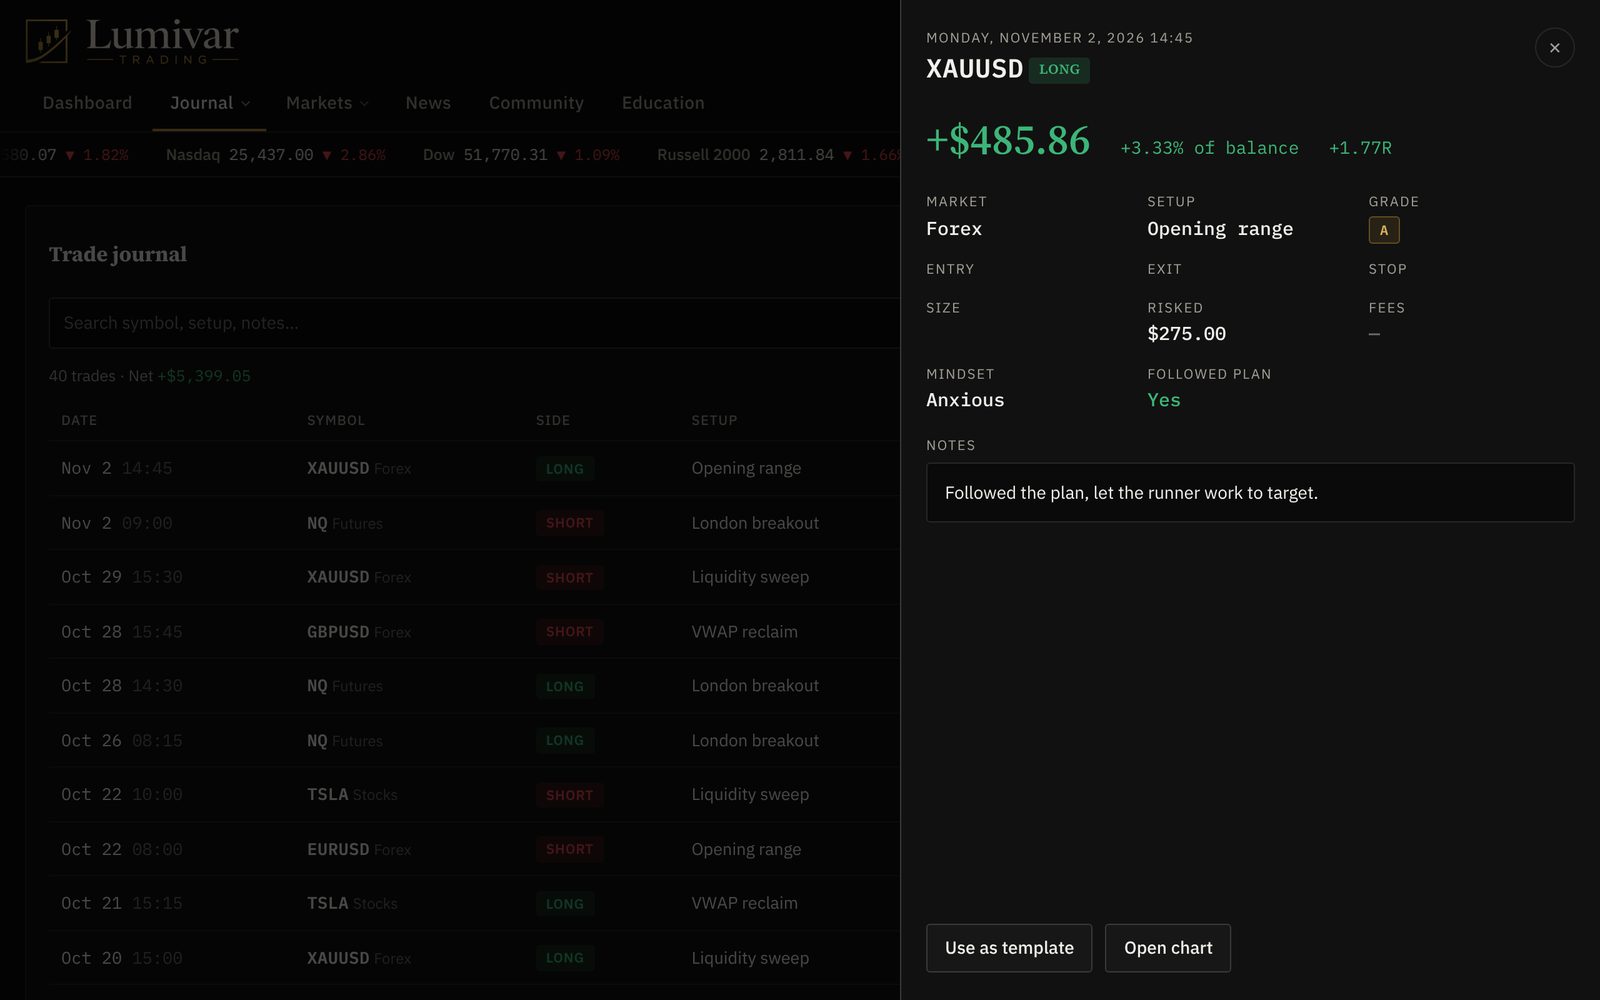 Open any trade to see the full story: result, R, setup, mindset, plan and notes. Reuse it as a template for similar trades.
Step 3: Review your day on a P&L calendar
At the end of each day, look at the result in the context of the week and month. A P&L calendar makes patterns visible at a glance: clusters of red days after a big win, overtrading on Mondays, or a strong run you started to give back.
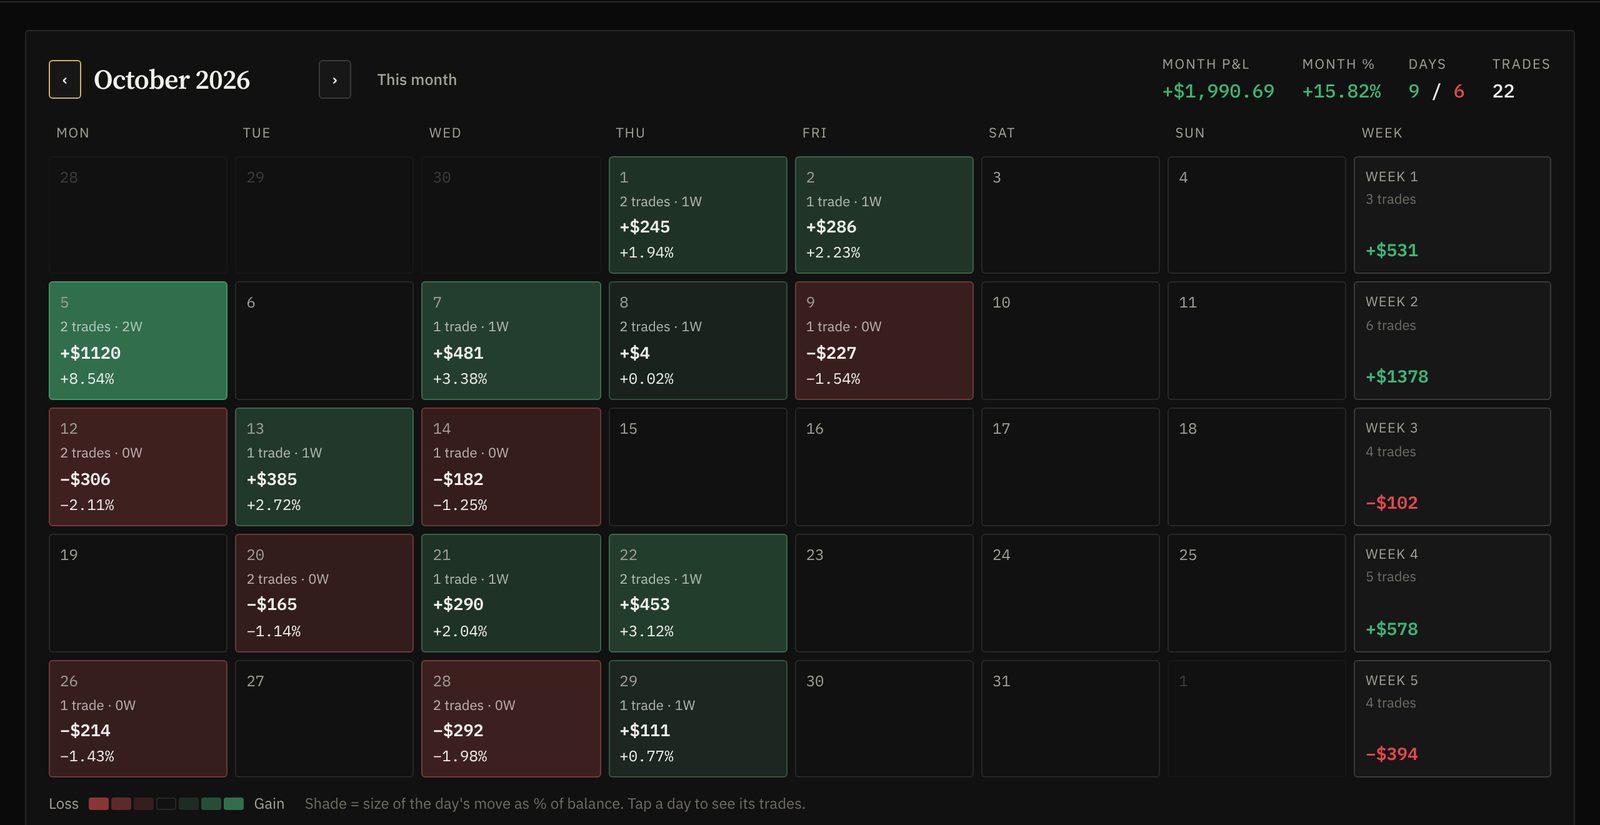 The P&L calendar: each day shaded by the size of its move, with weekly totals on the right. Tap a day to see its trades.
Step 4: Do a weekly trade review
Once a week, set aside 20–30 minutes. Go through every trade and ask:
- Did I follow my plan? Count the trades where you didn't, and add up what they cost.
- Which setup worked best this week, and which didn't?
- What was my average R on winners and losers? If winners average +0.8R and losers −1R, you need a very high win rate just to break even.
- When did I trade worst? Time of day, day of the week, after a loss, when tired.
- One thing to do differently next week. Just one, written down.
Before the week starts, check the economic calendar for high-impact news such as CPI, central bank decisions and non-farm payrolls. Our weekly market outlook covers what's coming up.
Step 5: Do a monthly deep dive with analytics
Monthly, zoom out. With 30+ trades you have enough data to see real patterns. Break your results down by setup, symbol, weekday, session and mindset, and compare long vs short.
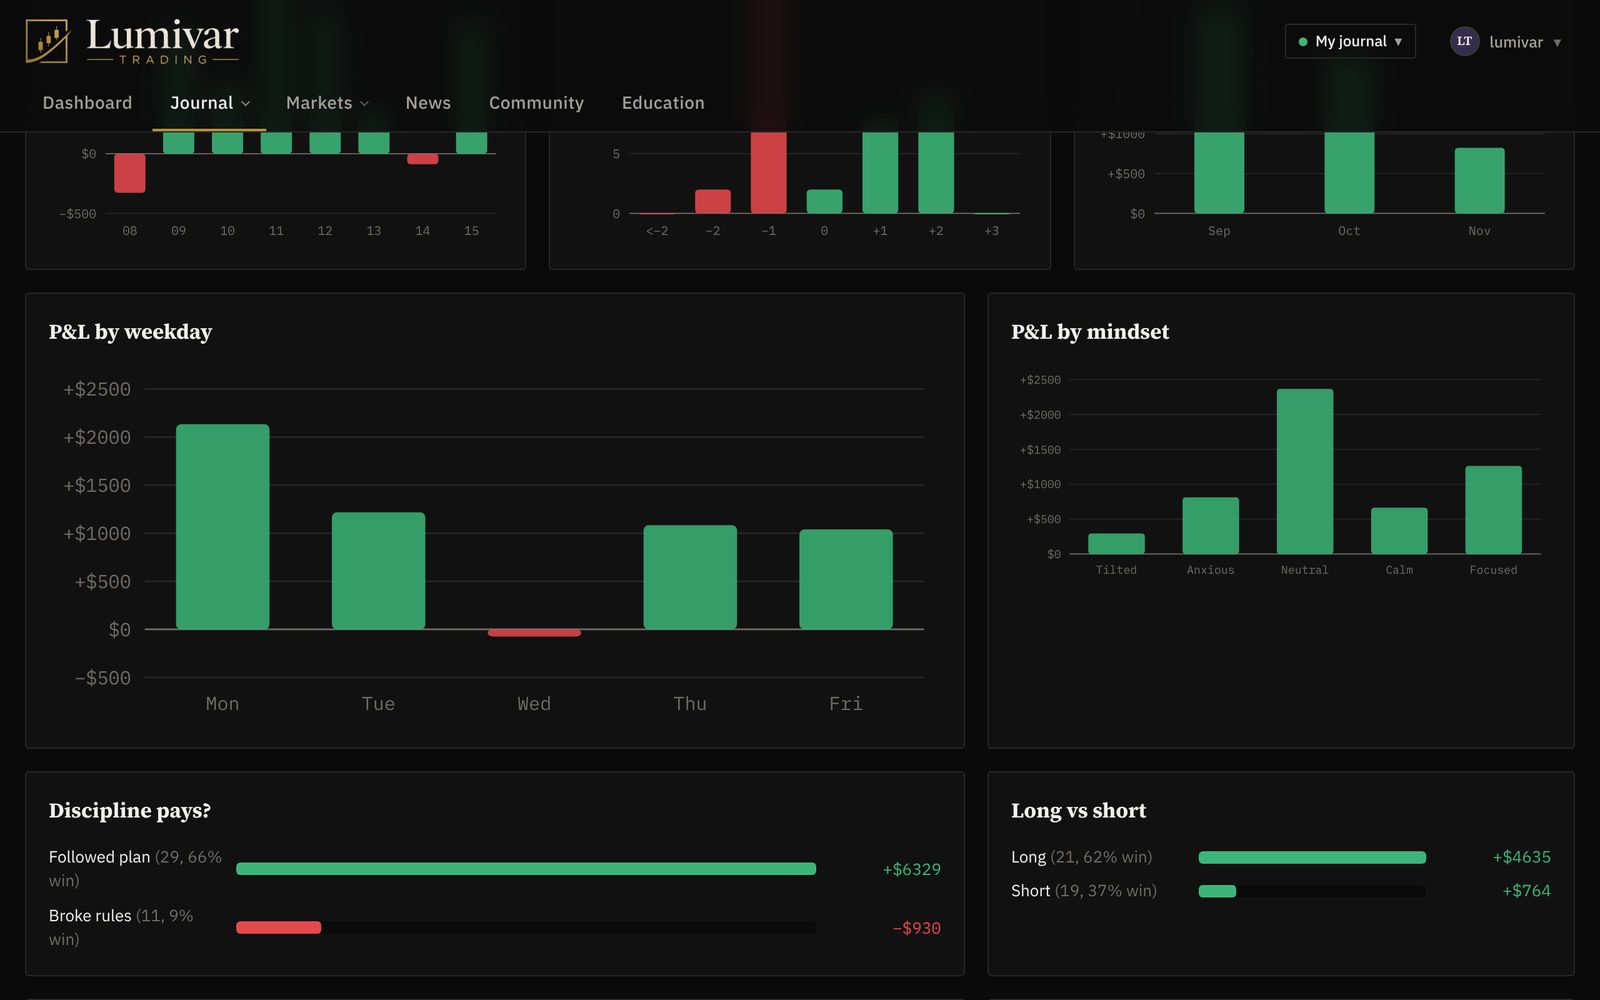 Analytics in Lumivar: P&L by weekday and mindset, and what following your plan is worth compared with breaking your rules.
This is where journaling pays for itself. In the example above, trades that followed the plan made +$6,329 while trades that broke the rules lost $938. Numbers like that change behaviour far faster than willpower does.
The trading journal metrics that matter
You don't need dozens of statistics. These are the ones worth tracking:
| Metric | What it tells you | How it's calculated |
|---|---|---|
| Net P&L | Whether you're making money, after fees | Sum of all trade results |
| Win rate | How often you win | Winning trades ÷ total trades |
| Average R | How big your wins and losses are relative to risk | Average of each trade's R-multiple |
| Profit factor | How much you make for every unit you lose | Gross profit ÷ gross loss (above 1.5 is solid) |
| Expectancy | What an average trade is worth | (Win rate × avg win) − (loss rate × avg loss) |
| Max drawdown | The worst peak-to-trough fall | Largest drop in your equity curve |
| Plan adherence | How disciplined you are | Trades that followed the plan ÷ total trades |
Win rate on its own is misleading. A 35% win rate is excellent if your winners average +3R; a 70% win rate can still lose money if your losers are three times your winners. Use the risk/reward calculator to see the break-even win rate for any R:R.
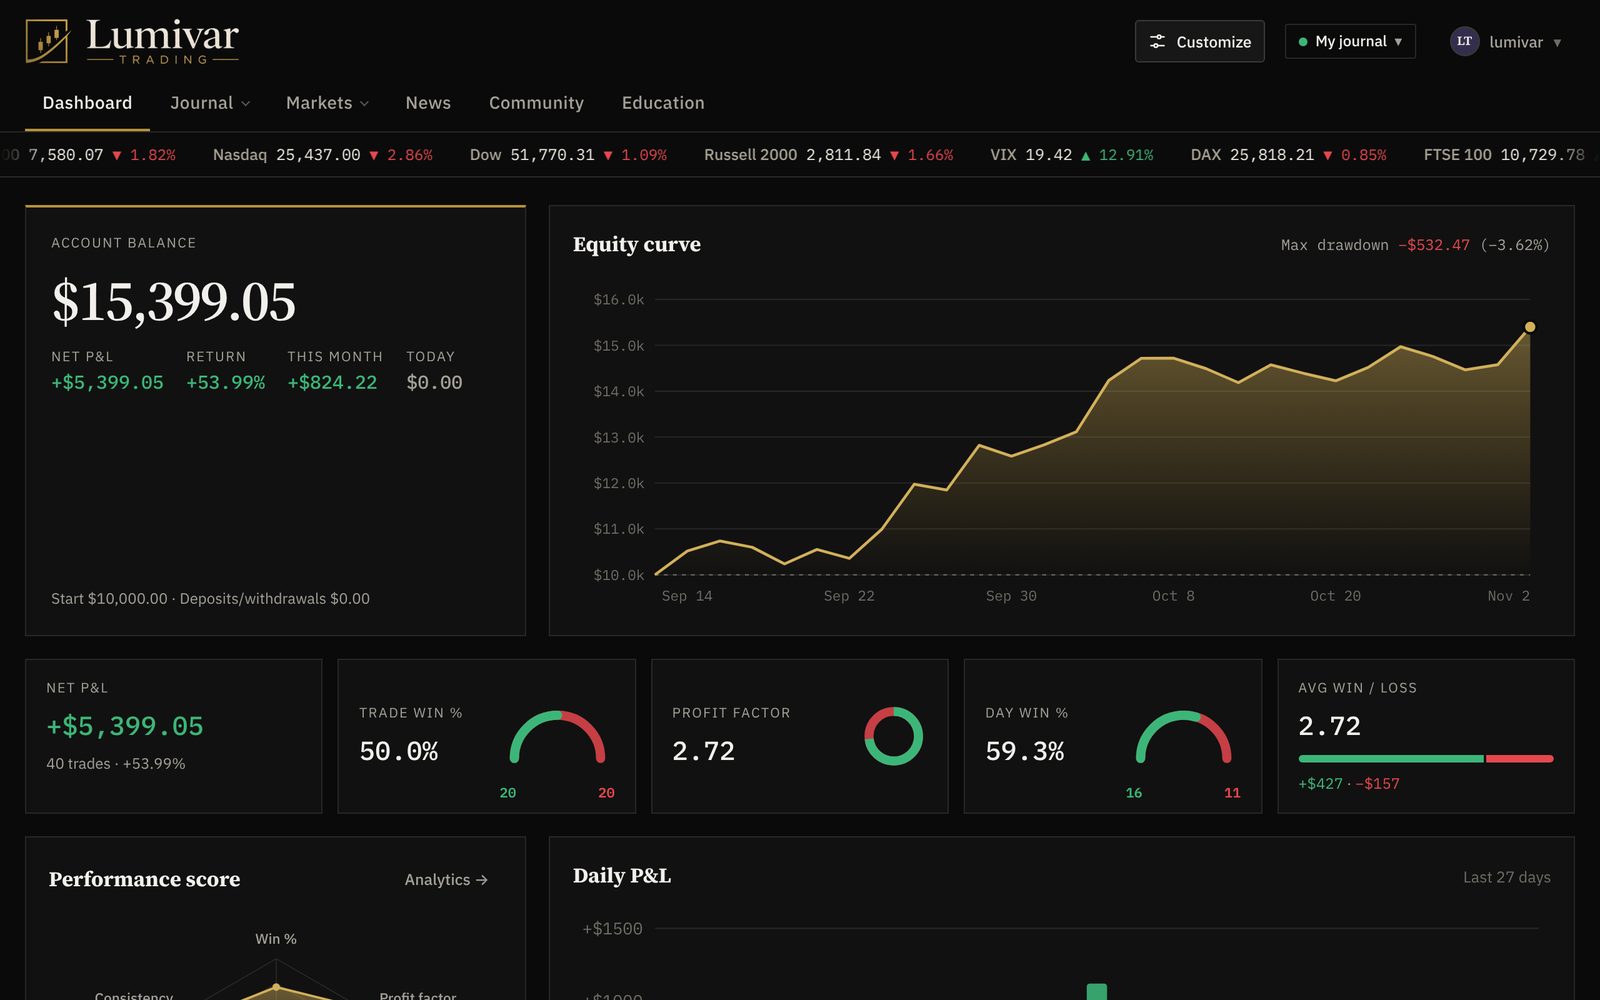 The dashboard puts the key numbers together: balance, equity curve, win rate, profit factor and average win vs loss.
Trading psychology: what to journal beyond the numbers
Most trading mistakes are behavioural, not technical. Your journal is the best tool you have for spotting them:
- Mindset before the trade. Tag it every time. If "anxious" or "FOMO" trades lose money consistently, you have a clear rule: don't trade in that state.
- Rule breaks. Moving a stop, adding to a loser, trading outside your hours, taking a setup that isn't in your playbook. Mark it, and count it.
- Revenge trading. Look for trades taken within minutes of a loss. Their results are usually worse than the rest.
- Overconfidence. Check your size and results on the trade after a big win.
A pre-trade checklist stops many of these before they happen. Tick every box before you click buy:
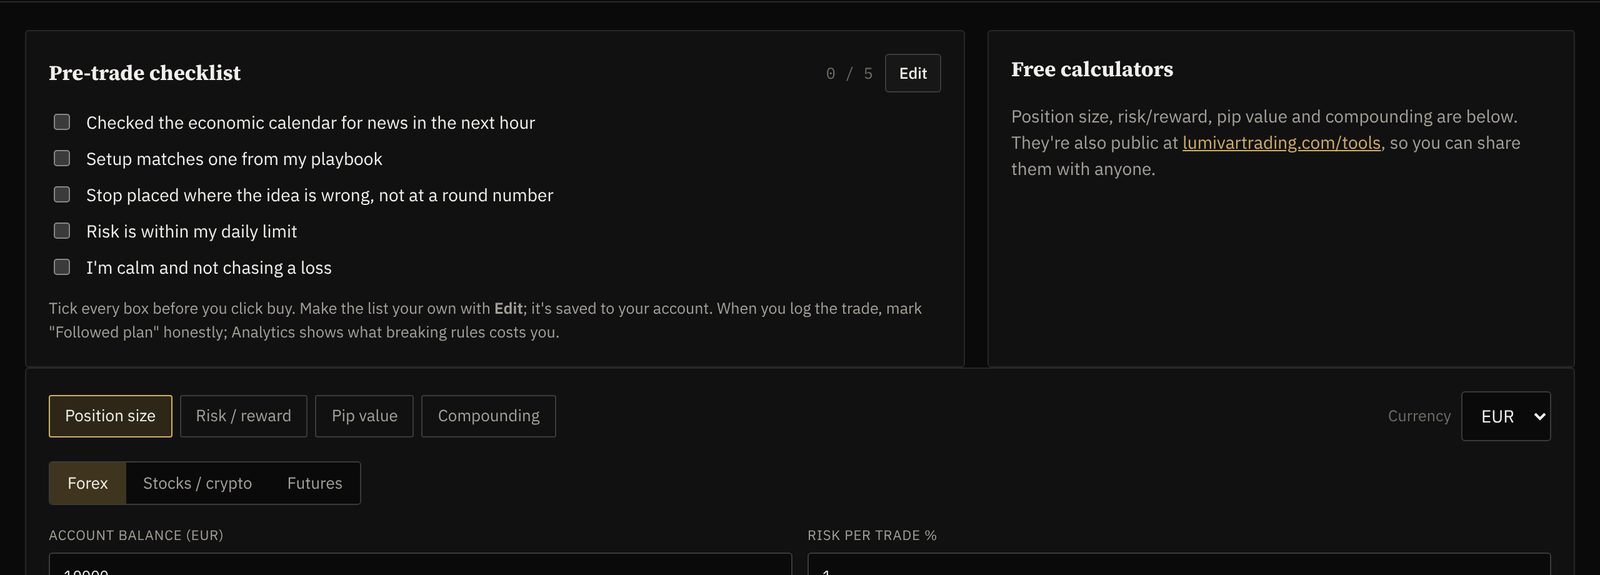 A customisable pre-trade checklist sits next to the free trading calculators in the Lumivar journal.
Common trading journal mistakes
- Only logging winners, or skipping the days you'd rather forget.
- Writing essays. Long notes feel productive but you won't keep it up. One or two lines per trade is enough.
- Inconsistent setup names. "Breakout", "BO" and "london brk" become three different setups in your stats. Pick names and stick to them.
- Never reviewing. A journal you never read is just data entry. The weekly review is where the value is.
- Judging trades by the result. Grade the execution. A good trade that lost is still a good trade.
- Not recording risk. Without a stop and amount risked you can't calculate R, and R is what makes your results comparable.
Spreadsheet, notebook or trading journal app?
| Notebook | Spreadsheet | Trading journal app | |
|---|---|---|---|
| Cost | Free | Free | Free to paid |
| P&L and R calculated for you | No | With formulas | Yes |
| Screenshots with each trade | Printouts | Links | Built in |
| Charts and analytics | No | Manual | Automatic |
| Import from your broker | No | Manual copy | Yes |
| Good for | Discretionary notes | Small number of trades | Active traders |
If you trade more than a few times a week, an app saves hours and gives you analytics a spreadsheet can't match without serious work.
Lumivar is a trading journal built around the workflow in this guide: log or import trades, add setup, mindset, plan and screenshots, then review them on the P&L calendar, dashboard and analytics. The free plan includes up to 30 trades a month with the P&L calendar; Pro adds full analytics, a customisable dashboard, unlimited trades and multiple journals.
Frequently asked questions
How often should I review my trading journal? Log every trade daily, do a short review at the end of each trading day, a proper review weekly, and a deeper analytics review monthly.
What should a forex trading journal include? The same fields as above, plus the pair, lot size and pip result. Pip values vary by pair and account currency, so a pip value calculator helps keep P&L accurate.
How many trades do I need before the statistics mean anything? Patterns start to appear after 30–50 trades per setup. Before that, focus on consistency of logging and plan adherence rather than win rate.
Should I journal demo or paper trades? Yes. Journaling a demo account builds the habit and tests a strategy before real money is at risk. Keep demo and live trades in separate journals so the results don't mix.
Is a trading journal worth it for long-term investors? Yes, in a lighter form. Record why you bought, your thesis, and what would make you sell, then review it when you exit.
Start your trading journal today
You don't need a perfect system to start. Log your next trade with the numbers, the risk and one line of context. Do it again tomorrow. Review it on Friday. In a month, you'll know more about your trading than a year of trading from memory could tell you.
This guide is for education only and is not investment advice. Trading involves substantial risk of loss.